This case study is best experienced on a laptop or desktop. The mobile version is still under construction.
Arka case study
Solar, finally understood.
// 01 The Brief
India's solar boom has a comprehension problem.
Every app shows the numbers. None of them answer the question.
Solar monitoring apps were designed for the engineers who installed
the system, not the people who paid for it. This case study is
about a deliberate tradeoff: demoting raw monitoring and promoting
homeowner confidence: what is working, what it means, and what to
do next.
// Time to confidence
18min
Average time for a homeowner to understand what their solar system is doing while using existing apps.
Homeowner comprehension72%
Could not answer basic performance questions from their monitoring app, even after months of use.
Navigation difficulty74%
Could not find a specific data point without scrolling through multiple screens.
Installer dependency58%
Called their installer not for technical problems, but to decode what the app was showing.
Plain-language context0/4
Major apps translated the primary metric into homeowner confidence at the point of reading.
01
Financial anxiety from raw metrics
"18.4 kWh" is accurate, but it does not answer whether the
₹3-5 lakh investment is saving money today.
02
Navigation designed for engineers
The information architecture followed inverter categories and
technical logs, not homeowner questions.
03
The installer became the UI
When users cannot understand the interface, the installer
becomes a human translation layer for basic product comprehension.
Design diagnosis
The missing feature was not more analytics. It was meaning.
// 02 Research
The data was there. The understanding wasn't.
Five methods. One question: where does technically correct information stop being useful to the person reading it? The research separated data depth from homeowner confidence because the problem was not whether the app had information, but whether the owner could act on it without translation.
01
Survey
Comprehension, navigation difficulty, and installer dependency across 78 homeowners.
02
Competitive audit
Four major solar monitoring apps reviewed for data depth, clarity, and actionability.
03
User interviews
Solar homeowners on monitoring habits, trust, savings, and disengagement.
04
Task testing
Could users answer basic questions from existing app structures?
05
App teardown
Where meaning is hidden behind metric labels, dashboards, and technical categories.
01
What homeowners actually need
When asked what they primarily want to know when opening the app, homeowners were unambiguous. The apps were built for engineers. The needs were financial and emotional.
Primary reason for opening the solar monitoring app
% OF RESPONDENTS — PRIMARY QUESTION ONLY
N=78 · SURVEY
Financial reassurance — ROI & savings91%
System health & operational status84%
Projected payback timeline78%
Grid contribution & net metering61%
Engineering & raw technical metrics12%
02
Competitive audit
Evaluated against the five criteria homeowners said mattered most. The pattern was consistent across every app in the category.
Criteria
SolarEdge
Enphase
Fronius
Luminous
Plain-language system status
Savings in ₹, not kWh
Actionable alert hierarchy
Domestic vocabulary
Performance context
Absent
Partial
03
Independent validation
The pattern wasn't unique to Indian apps.
Solarman Smart · UX Audit · 2025
8 in 10 users misclicked on basic navigation tasks. Independent audit by a homeowner-designer.
CEEW · NREL · Residential solar engagement
~6 in 10 homeowners become passive app users within 6 months of installation.
04
In their own words.
"The data is there. The meaning isn't. Every morning I open the app and feel like I need a PhD just to understand if everything is working."
Homeowner · Ahmedabad · 2 yr solar user
"I had no idea the panel output had dropped 40% over six months. I thought everything was fine. The app never told me anything was wrong."
Homeowner · Pune · 2.5 yr solar user
"I want to feel like the system is working for me, not the other way around. I shouldn't have to decode it every time I open the app."
Homeowner · Ahmedabad · 3 yr solar user
"I got told the app was fine to use. I just can't understand it. So I stopped checking. That can't be good."
Homeowner · Pune · 18 month solar user
05
From finding to decision.
Research only matters if it changes the product. Each insight mapped directly to a structural design decision.
01
Data without meaning creates anxiety.
Accurate metrics were not enough. The same drop could mean weather variation, seasonal change, or a real fault.
Therefore: lead with status, not raw metrics. Every key number needs a plain-language sentence before interpretation is required.
02
Financial interpretation is the first user need.
Homeowners installed solar to save money, but apps foregrounded generation data instead of savings meaning.
Therefore: surface savings, bill impact, and ROI early. Technical detail follows financial meaning, not the other way around.
03
Installer calls are a symptom of UI failure.
The support call often replaced the app's job of explaining system state and next action.
Therefore: explain system state and action clearly. If the homeowner still needs to call, the design has failed.
04
Trust erodes over time.
Users didn't reject the app immediately. They stopped checking when repeated visits failed to build confidence.
Therefore: design for repeat reassurance. Every return visit should answer "still okay?" before anything else.
05
~65% of homeowners stop engaging with the app within 6 months.
The problem was not awareness. Homeowners knew the app existed. They stopped returning because repeated visits failed to answer anything quickly. CEEW · NREL · Secondary research
Therefore: design for the check-in, not the monitor. Every session should answer one question in under a minute, or the homeowner won't come back.
Want financial reassurance first
91%
The primary reason homeowners open a solar monitoring app.
After · Arka
4min
Time to confidence. Down from 18.
Average session time · Arka
47s
Check-in, not monitor. Short, purposeful, not anxious.
Faster to understanding
78%
Reduction in comprehension time across 12 task sessions.
// 03 Product Thesis
The data was never the problem. The language around it was.
The product bet was to show less at first, not more. Arka does not ask homeowners to monitor solar like technicians. It decides which signal deserves attention, translates it into meaning, and keeps proof available for anyone who wants to go deeper.
01
Status before stats
Every screen opens with whether the system is okay, in plain language, before any number appears.
02
Meaning over metric
"Generated 12% above expected" comes before "18.4 kWh." The number supports the meaning, not the other way around.
03
Proof on demand
Technical detail is reachable in two taps for anyone who wants it. It is never the entry point.
04
Action when needed
If something needs attention, the app says so directly and tells the homeowner exactly what to do next.
// 04 Strategy
Same data. Different language.
The same inverter telemetry. The same kWh, the same alerts. The strategic choice was to stop treating data as the interface. Arka turns telemetry into a sequence homeowners can trust: status first, meaning next, proof on demand, action only when needed.
Daily generation
"18.4 kWh" becomes "Solar performing well."
The number stays. It moves below the meaning. A normalised comparison replaces the raw value as the visual anchor.
"Inverter offline" becomes a three-part diagnosis.
What happened, what it means for the user, and what to do, in that order. Critical for the alert hierarchy to do its job.
Before · existing apps
⚠ Inverter offline
SYNC FAILED · 6H ERROR CODE · E-227 LAST PING · 03:42 AM
After · Arka
9:41
Your Home · Mumbai
Needs attention
Solar running. One thing to check.
18.4kWh
generated today · sync delayed 6 hrs
Needs your attention
Your inverter hasn't sent data in 6 hours. Your solar is likely still working, but we can't confirm your savings until it reconnects.
See what's happening →
// 05 Information Architecture
Four questions. One answer per tab.
Scroll to see the full screen hierarchy.
Pre-auth · Onboarding
Welcome / Add home
→
Connect solar system
→
System verification
→
enters app ↓
Home
"Is everything okay?"
Running normally
→
Needs attention
→
Night / battery mode
→
Weather forecast
→
Monthly comparison
⤷
Today's flow
·
Alert detail
Savings
"Is this worth it?"
Savings overview
→
Bill impact
→
Payback progress
→
Grid export earnings
→
Annual summary
⤷
Monthly trend
·
Benchmark
·
Savings goal
Health
"Is anything wrong?"
System healthy
→
Component health
→
Performance trend
→
Warranty tracker
⤷
Issue detail
·
Schedule service
·
Service history
Care
Ownership hub
→
Solar report
→
Documents vault
→
PM Surya Ghar subsidy
⤷
Installer contact
·
Share access
·
Service requests
Solid node = primary screen
Dashed node = drill-down
⤷depth marker
Scroll horizontally to see the full map →
// 06 Design System
A visual system for homeowner confidence.
Arka’s interface had to reduce monitoring anxiety, not make energy data feel more impressive. Warm surfaces keep the product domestic rather than technical, green anchors confidence, amber is reserved for solar evidence, and alerts are written as next steps instead of fault codes.
The first line answers “is everything okay?” before asking the homeowner to interpret any solar metric.
Meaning
Generation data is paired with plain-language interpretation, so the number becomes reassurance instead of work.
Proof
Savings and solar-powered tiles act as evidence that the system is working and the investment is still paying back.
05 — States
check_circle
Running normally
High confidence, no action needed.
notifications_active
Needs attention
Explain issue before asking action.
battery_charging_full
Battery ready
Night confidence without solar anxiety.
currency_rupee
Savings proof
Convert energy into bill meaning.
support_agent
Service needed
Move from anxiety to next step.
description
Report ready
Ownership record, not hidden settings.
06 — Assembly Rules
HomeStatus + meaning + proof + next action.
SavingsMoney saved + bill impact + payback progress + trend.
Health & CareSystem state + plain cause + severity + installer support.
// 07 Design Decisions
Three moments where the obvious answer was wrong.
Every project has decisions where the safe call would have produced a worse product. These are the three that mattered most.
Decision 01
The savings hero should be weekly progress, not payback.
A 5–7 year payback timeline is the most financially significant number in the app. It was also nearly impossible to design around without making every session feel like watching paint dry.
Option A · explored
Payback track as hero
Horizontal progress bar showing 35% recovered, with ETA. It is the most financially honest answer and addresses the biggest question a homeowner has.
Rejected · timeline too slow to motivate daily use
Option B · explored
Live generation curve
Real-time amber arc showing today's production against expected. Visually dynamic, technically rich, satisfies "is it working."
Rejected · doesn't answer the money question
Option C · chosen
Weekly savings card
Seven bars. Current week in focus. Today partially filled with a dashed outline. ₹2,840 saved. Best week this month.
This week
Best week this month
₹2,840
5 of 7 days · today ongoing
M
T
W
T
F
S
S
Visible weekly progress · payback as context one tap down
Therefore: use weekly progress as the hook. Payback exists one tap down, but the weekly card creates clear progress on a timescale humans actually feel.
Decision 02
Today's Insight sits flat on the page. No card.
Every other element on the Home screen is a card. The insight section is the only place the app uses plain prose directly on the background. This took five iterations to get right.
Option A · explored
Card with amber accent
Standard product UI pattern. Container, padding, light background tint. Visually consistent with the rest of the screen.
Rejected · felt like another widget to scan past
Option B · explored
Dismissable toast banner
Temporary surface element at the top of the screen. Treats the insight as interactable.
Rejected · alert fatigue risk, over-engineered
Option C · chosen
Flat editorial text
No card, no border, no background. Sits between two cards like a note written directly to you.
Battery
Battery ready for evening
Fully charged · 100%
Today's insight
Best generation window is right now. Make the most of it.
View today's flow →
System status
InverterOnline
Reads like the app is talking, not presenting
Therefore: let the words do the work. Removing the container keeps the insight from becoming another widget to scan and dismiss.
Decision 03
Three alert states, not two. Not four.
The first version had binary states: working or not working. The second had four severity levels. Neither was right.
Option A · explored
Binary: working / not working
Simplest possible model. Green for okay, red for problem. No ambiguity.
Rejected · too blunt, collapsed important nuance
Option B · explored
Four severity levels
Normal, Watch, Caution, Critical. Mirrors what the inverter actually reports technically.
Rejected · users couldn't distinguish Watch from Caution
Option C · chosen
Three states: Normal, Watch, Act
Each state maps to one user behaviour. Normal: nothing to do. Watch: be aware. Act: respond now.
Running normally
→ nothing to do
Watch
→ be aware
Needs attention
→ respond
Calibrated severity · one action per state
Therefore: collapse severity into three behaviours. Normal, Watch, and Act were easier to understand because each state maps to one clear user response.
// 08 Key Screens
The app, explained screen by screen.
Four states. Four moments in a homeowner's day. Each screen answers one question.
9:41
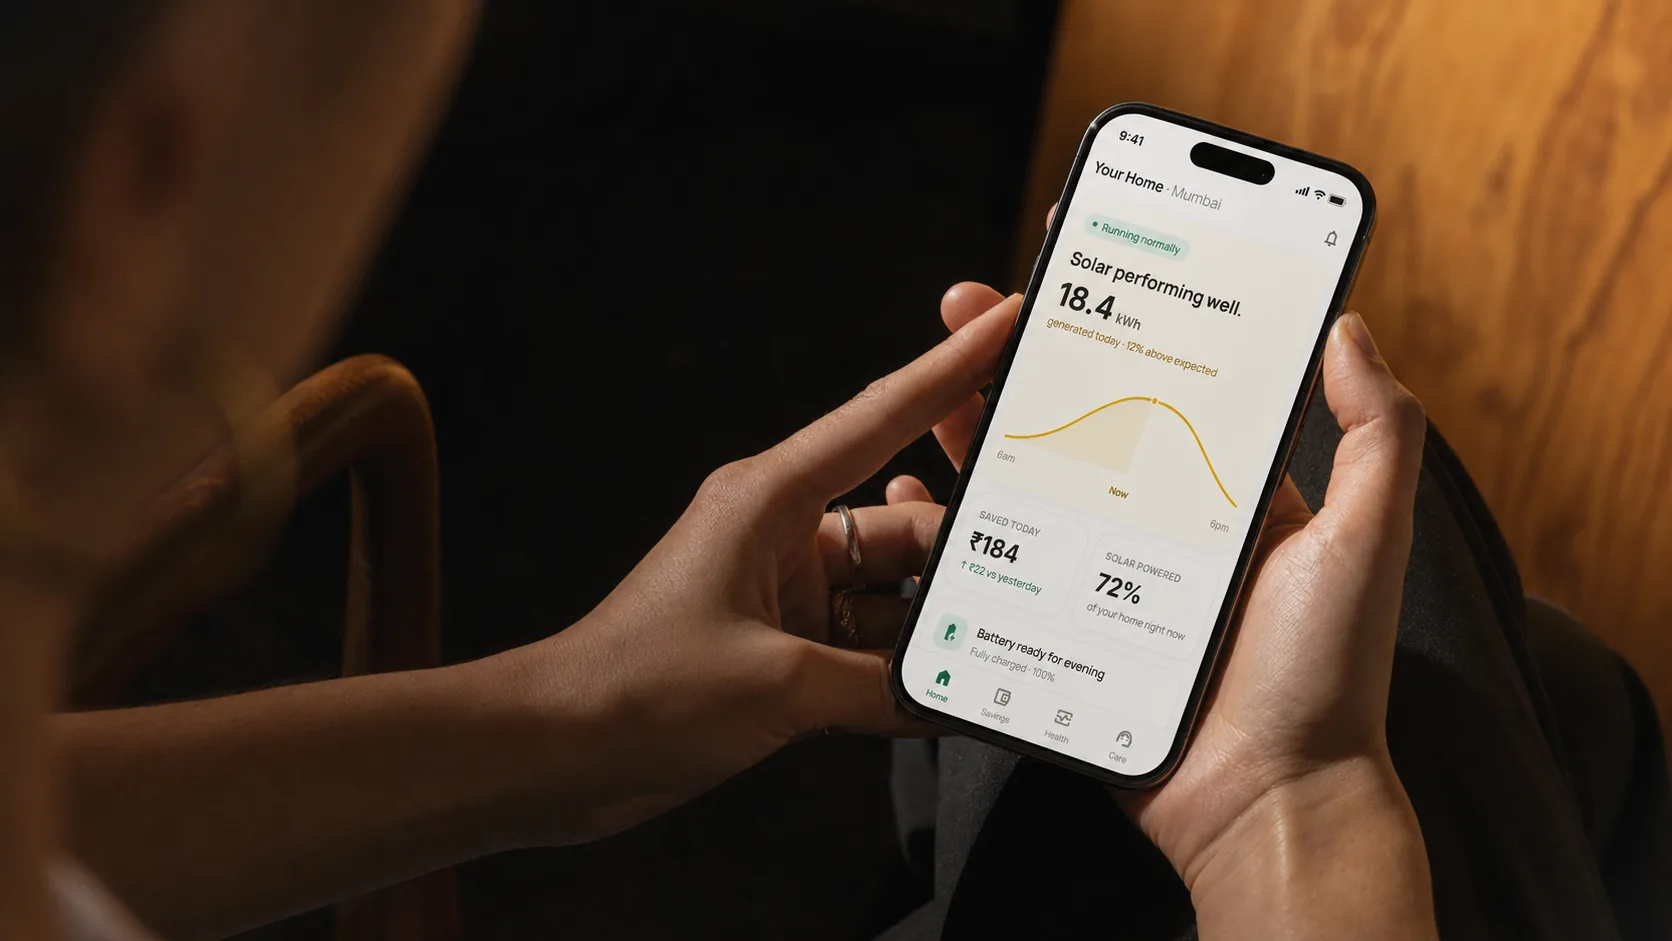
Your Home · Mumbai
notifications
Running normally
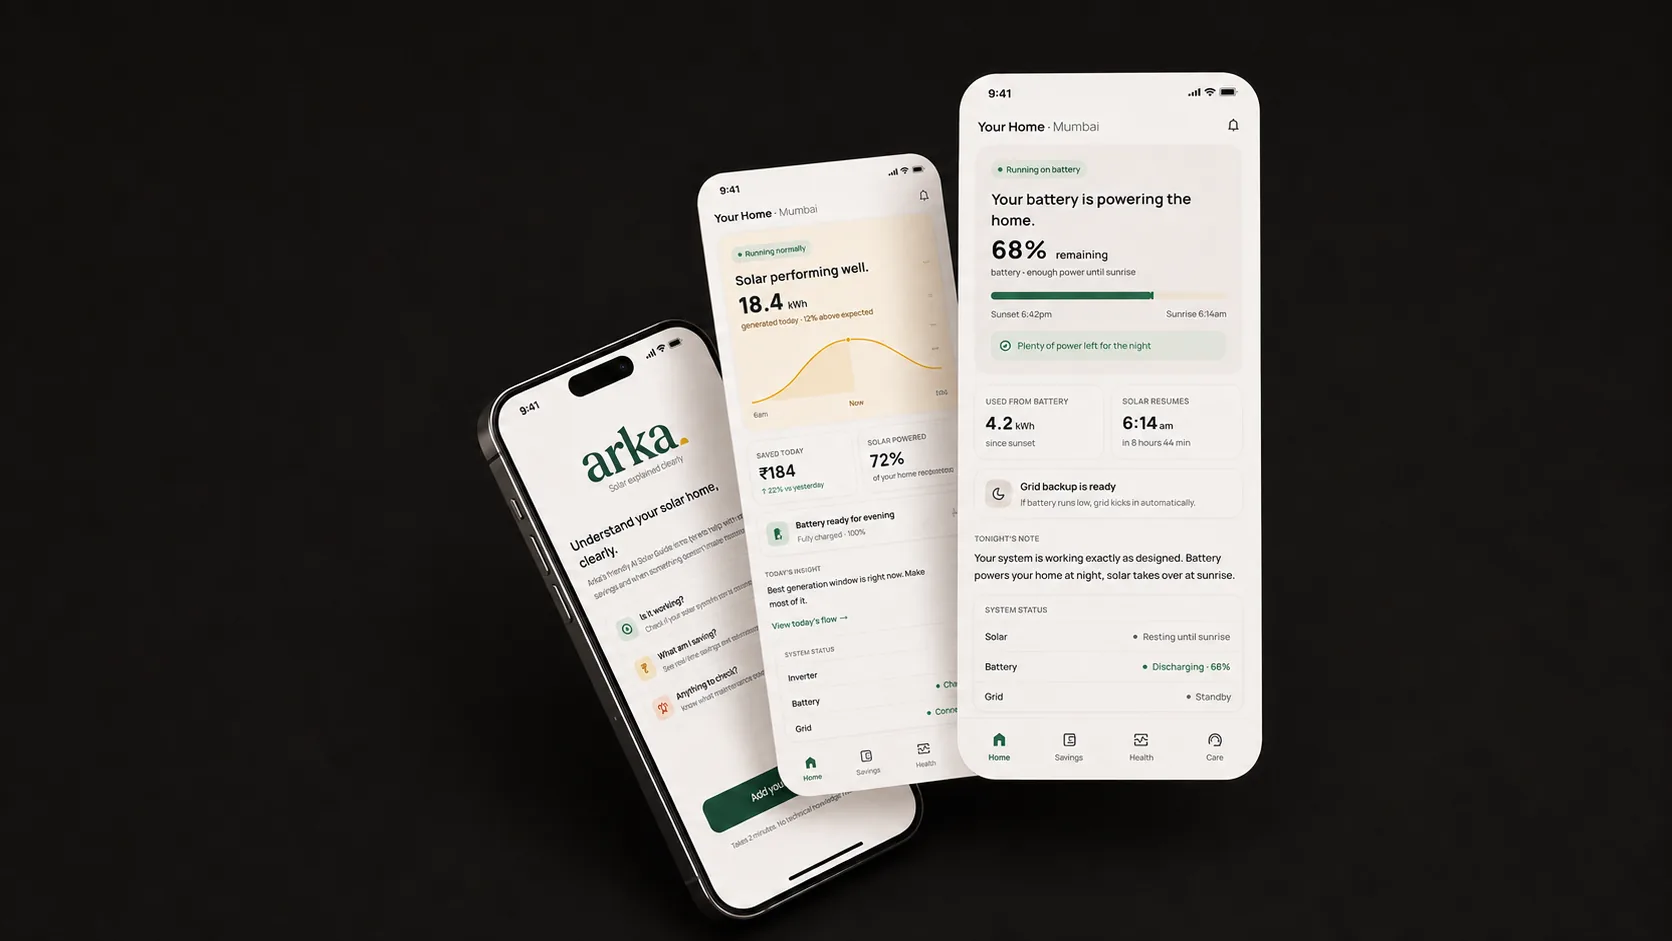
Solar performing well.
18.4kWh
generated today · 12% above expected
6amNow6pm
Saved today
₹184
↑ ₹22 vs yesterday
Solar powered
72%
of your home right now
battery_charging_full
Battery ready for evening
Fully charged · 100%
Today's insight
Best generation window is right now. Make the most of it.
View today's flow →
System status
Inverter
Online
Battery
Charged
Grid
Connected
homeHome
account_balance_walletSavings
monitor_heartHealth
support_agentCare
Running normally.
The default state. Solar is working, savings are visible, nothing needs attention. This is what 91% of sessions look like.
1
Status first, always
The green "Running normally" chip is the first thing on screen. Before any number, before any chart.
2
Plain language headline
"Solar performing well" instead of "18.4 kWh generated." The number is there, but the meaning leads.
3
Two proof tiles
₹184 saved today and 72% solar-powered answer the two questions users check most. One tap to deeper data.
4
Flat insight, no card
"Best generation window is right now" sits as editorial text between cards, not as a widget or notification.
9:41
Your Home · Mumbai
notifications
Running on battery
Your battery is powering the home.
68%remaining
battery · enough power until sunrise
Sunset 6:42pmSunrise 6:14am
check_circlePlenty of power left for the night
Used from battery
4.2kWh
since sunset
Solar resumes
6:14am
in 8 hours 44 min
dark_mode
Grid backup is ready
If battery runs low, grid kicks in automatically.
Tonight's note
Your system is working exactly as designed. Battery powers your home at night, solar takes over at sunrise.
System status
Solar
Resting until sunrise
Battery
Discharging · 68%
Grid
Standby
homeHome
account_balance_walletSavings
monitor_heartHealth
support_agentCare
Battery powering the home.
The night state. Solar is resting, battery is discharging. The app explains what's happening so the homeowner doesn't worry.
1
New hero state
"Your battery is powering the home" replaces the generation headline entirely. Same card, different answer.
2
68% — enough until sunrise
Battery percentage paired with plain-language reassurance. No mental math needed.
3
Sunset → Sunrise timeline
A time range the homeowner understands, not a technical discharge rate.
4
Tonight's note
"Your system is working exactly as designed." The most reassuring sentence in the app sits here as flat editorial text.
9:41
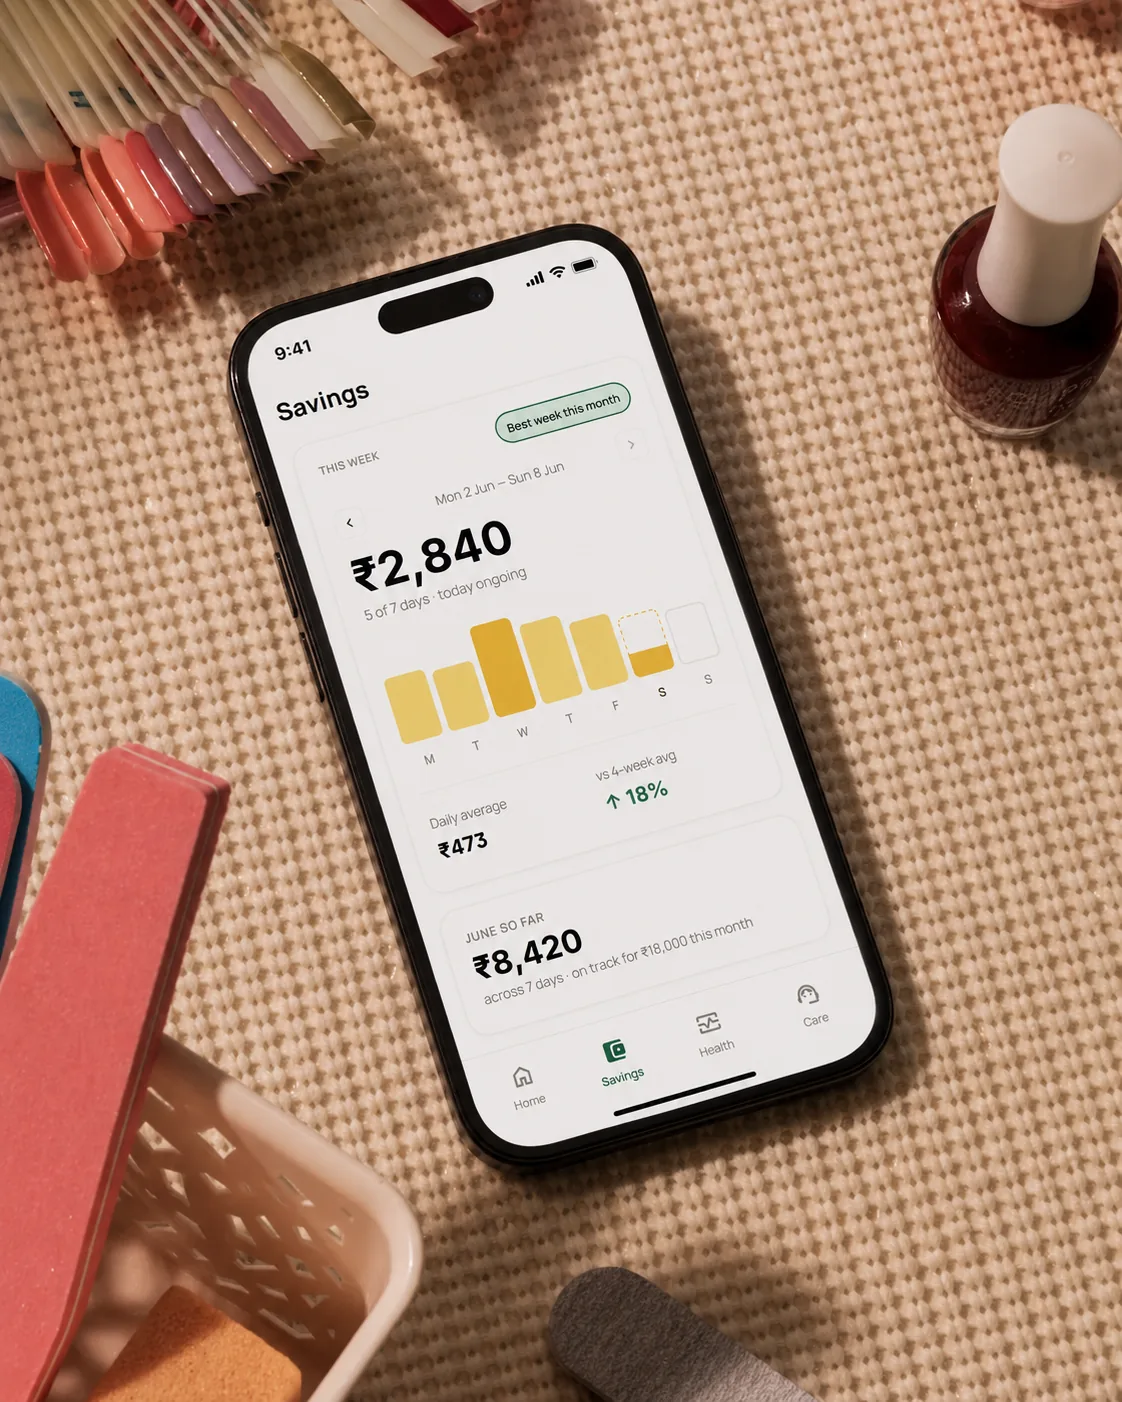
Savings
This week
Best week this month
Mon 2 Jun — Sun 8 Jun
₹2,840
5 of 7 days · today ongoing
M
T
W
T
F
S
S
Daily average
₹473
vs 4-week avg
↑ 18%
June so far
₹8,420
across 7 days · on track for ₹18,000 this month
chevron_right
Bill impact
See how solar changed your bill
chevron_right
Payback
How your investment is recovering
homeHome
account_balance_walletSavings
monitor_heartHealth
support_agentCare
₹2,840 this week.
The Savings tab. The weekly card is the hero, with seven bars and today partially filled. A dashed outline shows that the day is still in progress.
1
Weekly, not payback
Opens on this week, not the 8-year payback curve. The timescale a homeowner actually feels day to day.
2
Best week this month
A green badge makes a routine data point feel like an achievement without being patronising.
3
Today's bar is dashed
In progress, not complete. The current day shows a dashed outline above the solid fill.
4
Bill impact one tap down
The full ₹1,360 estimated bill lives one level deeper. The weekly card hooks; bill impact proves.
9:41
arrow_backBill impact
This month's estimate
₹1,360
Your estimated bill this month
Would have been ₹4,200 without solar
₹2,840 saved this month
You're paying 68% less than you would without solar.
Same month last year
Without solar₹4,200
With solar₹1,360
₹2,840 less per month
₹34,080 saved in the past 12 months
Monthly bill — last 12 months
JFMAMJJASOND
homeHome
account_balance_walletSavings
monitor_heartHealth
support_agentCare
₹1,360. Would have been ₹4,200.
The bill comparison screen is the most financially persuasive screen in the app. It shows what the homeowner actually paid compared with what they would have paid without solar.
1
Two numbers, one story
₹1,360 vs ₹4,200. The delta is the point. The layout makes both numbers equally visible.
2
₹2,840 saved — green highlight
The savings figure gets a green surface card so it reads as a positive outcome, not just a number.
3
68% less than without solar
Percentage framing for homeowners who think in proportions, not absolutes.
4
12-month bar chart
Grey bars before solar, green after. The story of adoption visible at a glance.
A curated cross-section. The ones that tell the story.
9:41
Solar explained clearly
Understand your solar home, clearly.
Always know if your solar is working, what you are saving, and when something needs your attention.
check_circle
Is it working?
Check if your solar home is running normally.
currency_rupee
What am I saving?
See how solar is reducing your electricity bill.
notifications_active
Anything to check?
Know when something is worth your attention.
Takes 2 minutes. No technical knowledge needed.
Welcome
9:41
chevron_leftBack
Step 1 of 2
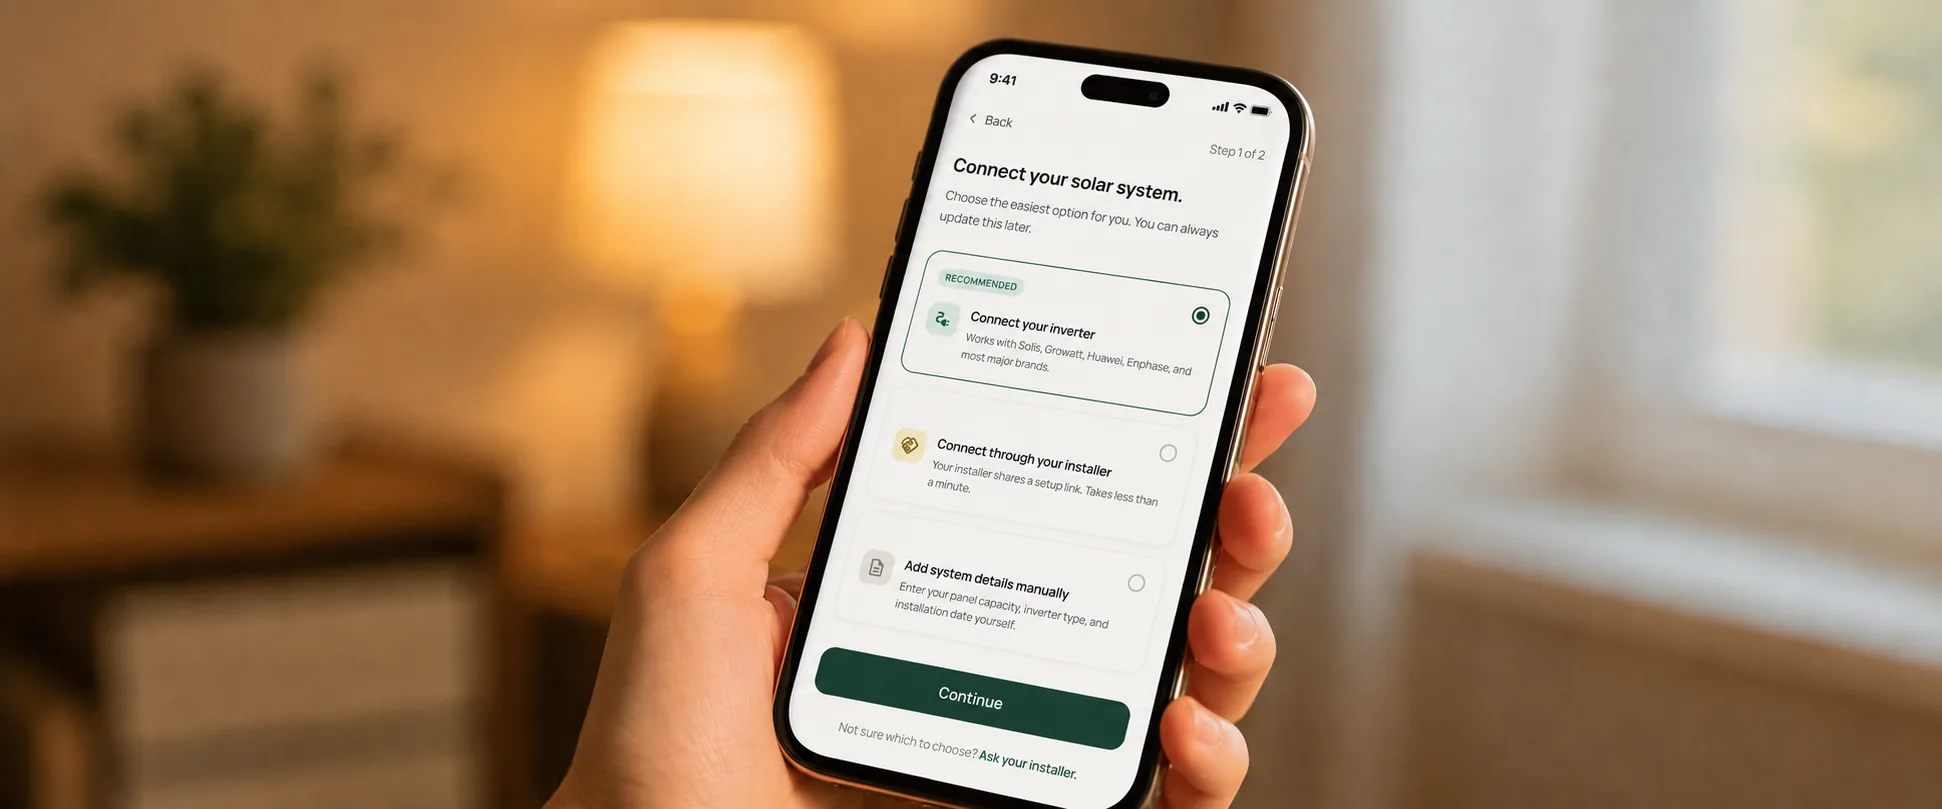
Connect your solar system.
Choose the easiest option for you. You can always update this later.
RECOMMENDEDradio_button_checked
electrical_services
Connect your inverter
Works with Solis, Growatt, Huawei, Enphase, and most major brands.
radio_button_unchecked
handshake
Connect through your installer
Your installer shares a setup link. Takes less than a minute.
radio_button_unchecked
description
Add system details manually
Enter your panel capacity, inverter type, and installation date yourself.
Not sure which to choose? Ask your installer.
Connect solar system
9:41
chevron_leftBack
Step 2 of 2
Connecting to your inverter.
This usually takes about 30 seconds. Keep the app open.
sync
check
Inverter found
Solis S6 Mini detected on your network
autorenew
Reading your system
Pulling capacity and live output
verified
Verifying first reading
We confirm before showing you any data
Stuck for over a minute? Get help
Connecting
9:41
check_circleCONNECTED
You're all set.
Your system is live and we're already listening.
LIVE NOW
Your panels are working.
2.4kW
generating right now · updated just now
What happens next
schedule
In an hour
Your first savings appear in rupees
bedtime
Tonight
Battery status and your generation curve come online
wb_sunny
Tomorrow
Your first full daily summary, ready to read
You're all set
9:41
Your Home · Mumbai
notifications
Running normally
Solar performing well.
18.4kWh
generated today · 12% above expected
6amNow6pm
Saved today
₹184
↑ ₹22 vs yesterday
Solar powered
72%
of your home right now
battery_charging_full
Battery ready for evening
Fully charged · 100%
Today's insight
Best generation window is right now. Make the most of it.
View today's flow →
System status
Inverter
Online
Battery
Charged
Grid
Connected
homeHome
account_balance_walletSavings
monitor_heartHealth
support_agentCare
Home — Running normally
9:41
Your Home · Mumbai
notifications
Needs attention
Solar running. One thing to check.
18.4kWh
generated today · sync delayed 6 hrs
6amNow6pm
Saved today
₹184
↑ ₹22 vs yesterday
Solar powered
72%
of your home right now
battery_charging_full
Battery ready for evening
Fully charged · 100%
Needs your attention
Your inverter hasn't sent data in 6 hours. Your solar is likely still working, but we can't confirm your savings until it reconnects.
See what's happening →
System status
Inverter
Sync delayed
Battery
Charged
Grid
Connected
homeHome
account_balance_walletSavings
monitor_heartHealth
support_agentCare
Home — Needs attention
9:41
Your Home · Mumbai
notifications
Running on battery
Your battery is powering the home.
68%remaining
battery · enough power until sunrise
Sunset 6:42pmSunrise 6:14am
check_circlePlenty of power left for the night
Used from battery
4.2kWh
since sunset
Solar resumes
6:14am
in 8 hours 44 min
dark_mode
Grid backup is ready
If battery runs low, grid kicks in automatically.
Tonight's note
Your system is working exactly as designed. Battery powers your home at night, solar takes over at sunrise.
System status
Solar
Resting until sunrise
Battery
Discharging · 68%
Grid
Standby
homeHome
account_balance_walletSavings
monitor_heartHealth
support_agentCare
Home — Night mode
9:41
arrow_backToday's flow
Live
Solar powering your home
Your solar is covering everything right now.
2.8kW
solar output right now
Right now
Solar generating
2.8kW
Home consuming
2.1kW
Battery charging
0.7kW
What this means
Your solar is fully covering your home and charging your battery. You are not drawing from the grid at all.
Today so far
Generated today
14.2kWh
since 6am
Saved today
₹184
↑ above average
homeHome
account_balance_walletSavings
monitor_heartHealth
support_agentCare
Today's flow
9:41
arrow_backAlert detail
warning
Inverter sync delayed
Detected 6 hours ago
Your inverter hasn't sent data to Arka in 6 hours. This can happen if your home WiFi is interrupted or if the inverter lost its connection.
What this means for you
Your solar is likely still generating normally.
We can't confirm today's savings until reconnected.
No action needed unless this continues past 24 hours.
What to do
1
Check that your home WiFi is working normally.
2
Check the inverter display — it should show a green light or normal reading.
3
If the issue persists after 24 hours, contact your installer.
homeHome
account_balance_walletSavings
monitor_heartHealth
support_agentCare
Alert detail
9:41
Savings
This week
Best week this month
Mon 2 Jun — Sun 8 Jun
₹2,840
5 of 7 days · today ongoing
M
T
W
T
F
S
S
Daily average
₹473
vs 4-week avg
↑ 18%
June so far
₹8,420
across 7 days · on track for ₹18,000 this month
chevron_right
Bill impact
See how solar changed your bill
chevron_right
Payback
How your investment is recovering
homeHome
account_balance_walletSavings
monitor_heartHealth
support_agentCare
Savings overview
9:41
arrow_backBill impact
This month's estimate
₹1,360
Your estimated bill this month
Would have been ₹4,200 without solar
₹2,840 saved this month
You're paying 68% less than you would without solar.
Same month last year
Without solar₹4,200
With solar₹1,360
₹2,840 less per month
₹34,080 saved in the past 12 months
Monthly bill — last 12 months
JFMAMJJASOND
homeHome
account_balance_walletSavings
monitor_heartHealth
support_agentCare
Bill impact
9:41
arrow_backPayback progress
Recovered so far
₹1,24,800
On track
of your ₹3,60,000 investment · 35% recovered
35%
₹0₹1,80,000₹3,60,000
Full payback by
March 2028
Avg. monthly saving
₹4,200
Your recovery journey
System installedMarch 2023
Recovered so far₹1,24,800 · 35%
Estimated full paybackMarch 2028
Monthly recovery
Your system earns back an average of ₹4,200 every month. Some months more, some less depending on the season.
homeHome
account_balance_walletSavings
monitor_heartHealth
support_agentCare
Payback progress
9:41
Health
All clear
Your system is running normally.
Last checked: today at 1:30pm · All 4 components healthy
Components
electrical_services
Inverter
Last reading 2 min ago
Online
battery_full
Battery
Capacity 96% · 1,240 cycles
100%
wb_sunny
Solar panels
18 of 18 generating
+8%
cell_tower
Grid connection
Stable · no outages this month
Connected
This week
Your system has been running normally for 23 consecutive days. Generation is 8% above your seasonal average.
build
Next recommended service
March 2026 · Annual check-up
chevron_right
homeHome
account_balance_walletSavings
monitor_heartHealth
support_agentCare
System healthy
9:41
arrow_backIssue detail
solar_power
Panel output below expected
String 2 · Detected 2 days ago
One of your two panel strings is generating about 30% less than expected. Your solar is still working, but not at full capacity.
Impact on your system
Generation affected~1.8 kWh/day less
Estimated savings impact~₹55/day less
Possible causes
Dust or debris on a section of your panels.
A shading issue — new obstruction blocking sunlight.
A loose connection that needs a technician to check.
homeHome
account_balance_walletSavings
monitor_heartHealth
support_agentCare
Issue detail
9:41
arrow_backSchedule service
Service requested for
Panel output check · String 2
Your installer will inspect the affected panel string and check for dust, shade, or connection issues.
Your installer
SS
Suresh Solar Services
Your installer since March 2023
phone+91 98765 43210
Preferred date
Wed 11 Jun
Thu 12 Jun
Fri 13 Jun
Preferred time
Morning (9am–12pm)
Afternoon (1pm–5pm)
Notes for installer (optional)
Your installer will confirm within 24 hours.
homeHome
account_balance_walletSavings
monitor_heartHealth
support_agentCare
Schedule service
9:41
Care
chevron_right
description
Documents
Warranty & manuals
chevron_right
phone
Contact installer
Suresh Solar Services
chevron_right
download
Monthly report
Download June 2025
chevron_right
history
Service history
3 visits since install
Your system
System size5 kWp
InstalledMarch 2023
InverterSolis S6 Mini
InstallerSuresh Solar Services
Warranty status
wb_sunny
Solar panels22 years remaining
electrical_services
Inverter7 years remaining
Support
support_agent
Arka support
help.arka.in
chevron_right
chat
WhatsApp installer
+91 98765 43210
chevron_right
homeHome
account_balance_walletSavings
monitor_heartHealth
support_agentCare
Care hub
9:41
arrow_backJune report
chevron_leftJun 2025chevron_right
June 2025 summary
Generated
148 kWh
Saved
₹8,420
Exported
18 kWh
Daily generation — June
1 Jun30 Jun
June highlights
Best daySat 14 Jun · 22.1 kWh
Days above average18 of 30
Grid units exported18 kWh
Grid credit earned₹432
Service history
12
Mar
Annual inspection
Full system check. All components healthy.
Completed
08
Aug
Inverter firmware update
Remote update by installer. No issues found.
Completed
22
Mar
Installation
5 kWp system installed. 18 panels, Solis inverter.
Completed
homeHome
account_balance_walletSavings
monitor_heartHealth
support_agentCare
Solar report
// 09 Reflection
What changed. What didn't.
Changed my mind
The generation curve was demoted.
I expected the amber generation arc to become the hero because it made the system feel alive. Testing changed that. Homeowners noticed the curve, then immediately searched for a plain answer. The curve moved to a supporting role. The headline took the top because confidence mattered more than visual energy.
The alert system simplified to three states.
The first version had four severity levels (Normal, Watch, Caution, Critical) mirroring what the inverter technically reports. Users couldn't tell Watch from Caution in testing. Both felt like "something might be wrong." Collapsed to three. Normal, Watch, Act. Each maps to one behaviour.
Still unfinished
First-week empty states.
The savings tab with no history and the health tab before a single alert exist in the IA but were never fully designed. The app currently assumes data exists. The zero-state experience (days 1–7) is genuinely hard to get right and I didn't.
Notification content strategy.
The app knows when to alert. It doesn't yet know what to say in the smallest, highest-pressure format: a lock-screen notification. That layer was scoped out, but it is where the product thesis would be tested hardest. Can a 40-character message reduce anxiety instead of creating it?